Free Access
Fig. 19
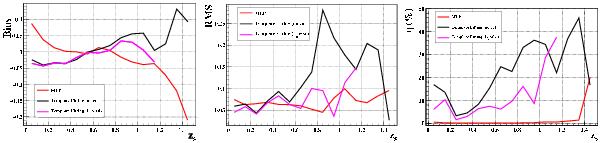
Comparison between the template-fitting method and the neural network for CFHTLS data. The bias, the rms of the distribution of Δz / (1 + zs), and the parameter η are displayed as functions of the true redshift for the CFHTLS data. Data points are reported only if the number of galaxies in the sample is greater than ten.
This figure is made of several images, please see below:
Current usage metrics show cumulative count of Article Views (full-text article views including HTML views, PDF and ePub downloads, according to the available data) and Abstracts Views on Vision4Press platform.
Data correspond to usage on the plateform after 2015. The current usage metrics is available 48-96 hours after online publication and is updated daily on week days.
Initial download of the metrics may take a while.