Free Access
Fig. 12
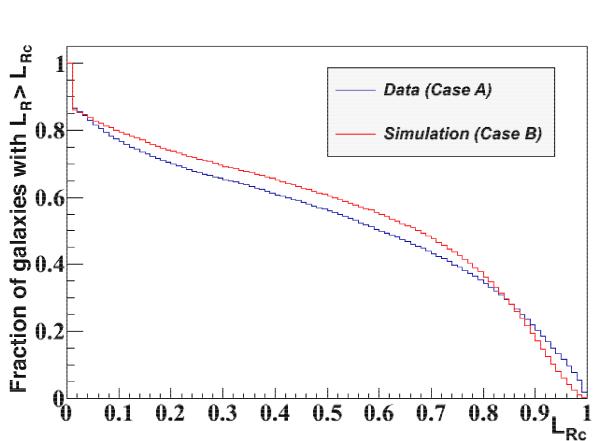
Histogram of the number of galaxies from the CFHTLS sample with LR ≥ LR,c as a function of LR,c. The blue curve has been obtained with densities P(μ|G) and P(μ|O), as computed from the CFHTLS data themselves, whereas the red curve relies on densities obtained from the CFHTLS simulation.
Current usage metrics show cumulative count of Article Views (full-text article views including HTML views, PDF and ePub downloads, according to the available data) and Abstracts Views on Vision4Press platform.
Data correspond to usage on the plateform after 2015. The current usage metrics is available 48-96 hours after online publication and is updated daily on week days.
Initial download of the metrics may take a while.