Fig. 6
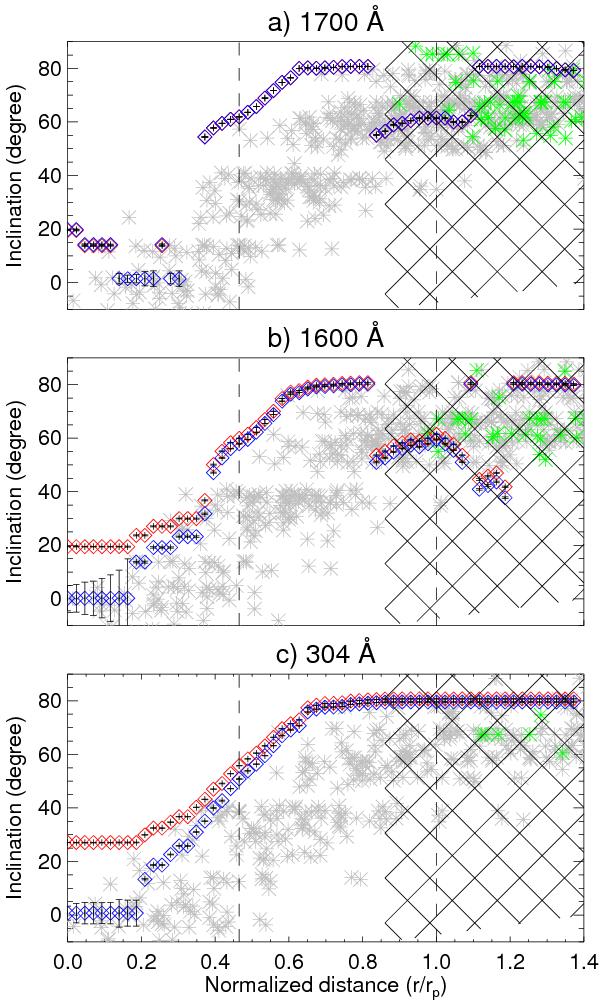
Comparison between the field inclination (red and blue diamonds) reconstructed by the cut-off frequency and the values obtained by potential field extrapolation (grey and green asterisks) in the 1700 Å a); 1600 Å b); and 340 Å c) bandpasses. The dashed lines show the umbra-penumbra boundary. The cross-hatched region indicates less-reliable measurements.
Current usage metrics show cumulative count of Article Views (full-text article views including HTML views, PDF and ePub downloads, according to the available data) and Abstracts Views on Vision4Press platform.
Data correspond to usage on the plateform after 2015. The current usage metrics is available 48-96 hours after online publication and is updated daily on week days.
Initial download of the metrics may take a while.