Free Access
Fig. 5
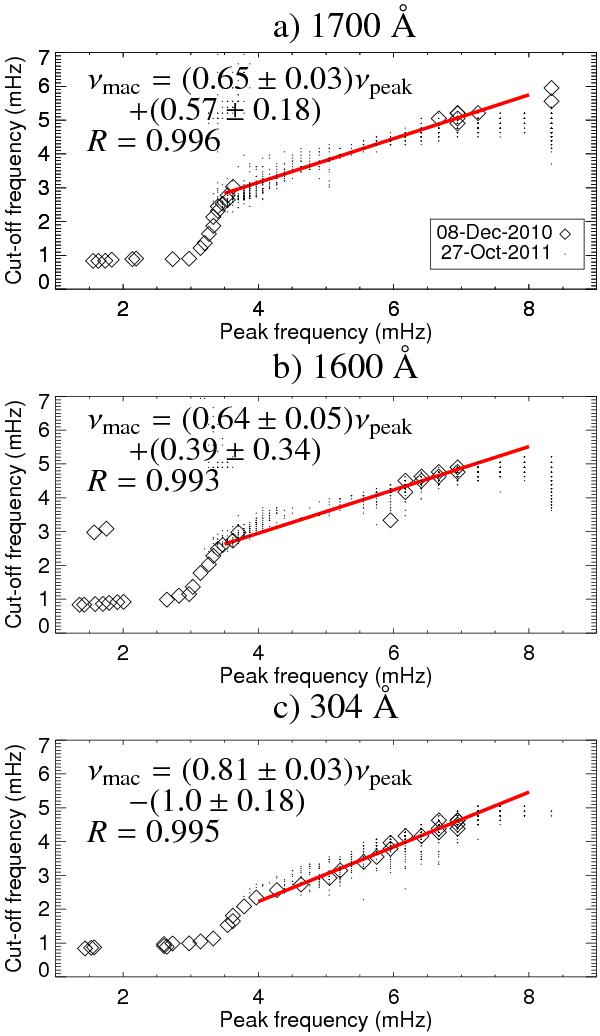
Scatter plot and the linear fits (red solid line) between the cut-off frequency and peak frequency in the 1700 Å a); 1600 Å b); and 304 Å c) data. The diamond symbols represent the measurements in sunspot AR11131 (08 Dec. 2010), while dot symbols indicate the data obtained for sunspot AR11330 (27 Oct. 2011).
Current usage metrics show cumulative count of Article Views (full-text article views including HTML views, PDF and ePub downloads, according to the available data) and Abstracts Views on Vision4Press platform.
Data correspond to usage on the plateform after 2015. The current usage metrics is available 48-96 hours after online publication and is updated daily on week days.
Initial download of the metrics may take a while.