Fig. 2
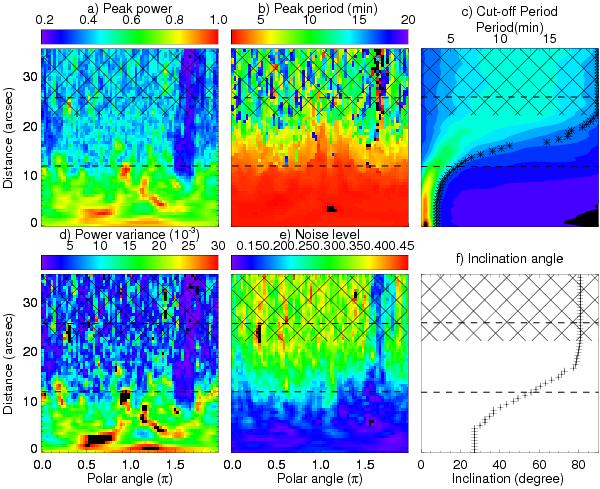
2D distribution of the peak power a); peak period b); power variance d); and noise e) in the 304 Å bandpass. The 1D power map as a function of the radius and period c). The asterisk and plus contours mark the cut-off period c) and the reconstructed magnetic inclination f). Panels a) and c) have the same colour table. The dashed lines mark the umbra–penumbra boundary. The region of low significance is cross-hatched.
Current usage metrics show cumulative count of Article Views (full-text article views including HTML views, PDF and ePub downloads, according to the available data) and Abstracts Views on Vision4Press platform.
Data correspond to usage on the plateform after 2015. The current usage metrics is available 48-96 hours after online publication and is updated daily on week days.
Initial download of the metrics may take a while.