Fig. 2
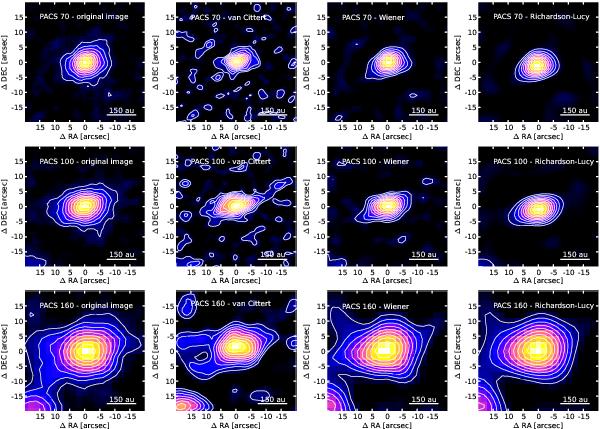
Original images and deconvolved images at the three Herschel/PACS bands. Image type, wavelength and deconvolution method are noted in the upper left corner of each panel, respectively. The images are oriented north up, east left. Contours denote positive surface brightness values and are drawn in steps of 10% of the peak surface brightness. The color scale is linear and ranges from zero to the peak surface brightness.
Current usage metrics show cumulative count of Article Views (full-text article views including HTML views, PDF and ePub downloads, according to the available data) and Abstracts Views on Vision4Press platform.
Data correspond to usage on the plateform after 2015. The current usage metrics is available 48-96 hours after online publication and is updated daily on week days.
Initial download of the metrics may take a while.