Fig. 2
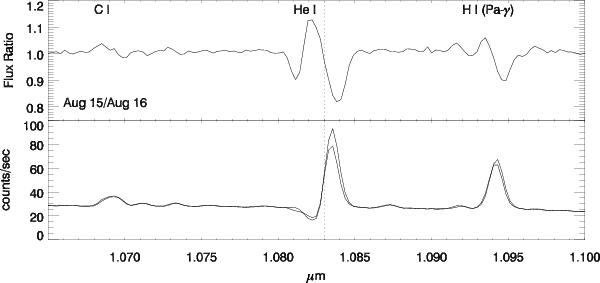
The λ 1.083 μm He i line on August 15 and 16, 2005. Spectra are normalized to the continuum. The upper panel shows the ratio of the spectrum of August 15 to that of August 16. The vertical line is the rest wavelength of the λ 1.083 μm He i line. The emission at He i and at H i Pγ (1.094 μm) increased, while the C i line at 1.069 μm did not change.
Current usage metrics show cumulative count of Article Views (full-text article views including HTML views, PDF and ePub downloads, according to the available data) and Abstracts Views on Vision4Press platform.
Data correspond to usage on the plateform after 2015. The current usage metrics is available 48-96 hours after online publication and is updated daily on week days.
Initial download of the metrics may take a while.