Fig. 11
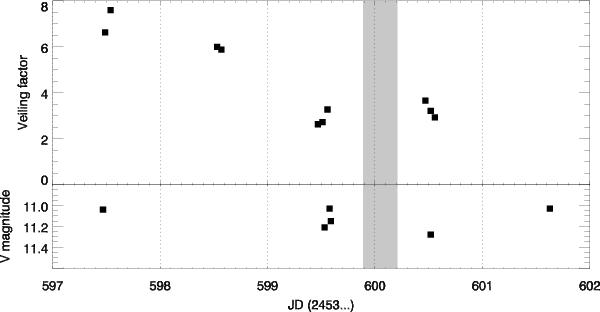
Variations in veling factor (VF, upper panel) and V magnitude (lower panel) over the 3rd observing period in August 2005 (photometric data from SMARTS and ASAS). The shaded area indicates the time interval over which X-ray observations were obtained (2nd point in Fig. 10). The large drop in veiling occurred from the second to the third night of ground-based observations.
Current usage metrics show cumulative count of Article Views (full-text article views including HTML views, PDF and ePub downloads, according to the available data) and Abstracts Views on Vision4Press platform.
Data correspond to usage on the plateform after 2015. The current usage metrics is available 48-96 hours after online publication and is updated daily on week days.
Initial download of the metrics may take a while.