Fig. 1
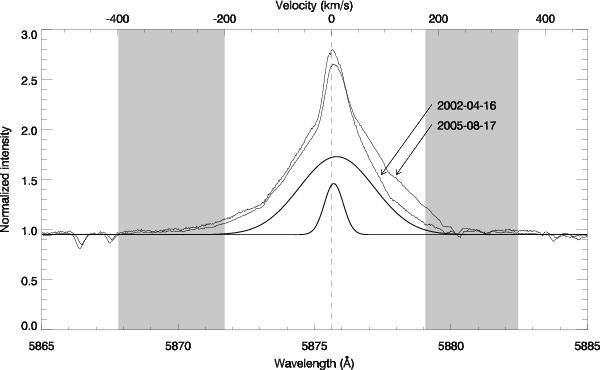
He i 5876 Å emission line profiles selected from two occasions when the red wing was weak (April 16, 2002) and strong (August 17, 2005). A Gaussian decomposition in three components was used to locate the two central components in all spectra, one narrow and one broad, while the third very broad and shallow component, which matches the wings, has no physical meaning and is not depicted. Shaded areas mark the intervals in the blue and red wing not influenced by the central components, and over which equivalent widths were measured.
Current usage metrics show cumulative count of Article Views (full-text article views including HTML views, PDF and ePub downloads, according to the available data) and Abstracts Views on Vision4Press platform.
Data correspond to usage on the plateform after 2015. The current usage metrics is available 48-96 hours after online publication and is updated daily on week days.
Initial download of the metrics may take a while.