Free Access
Fig. 1
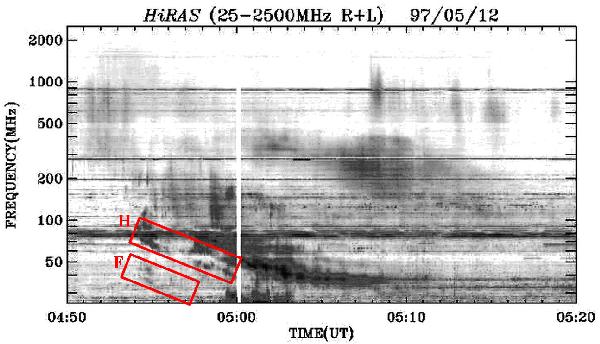
Radio dynamic spectrum from the Hiraiso Radio Spectrograph (HiRAS; inverse color scale: dark shading corresponds to bright emission) showing the Type II burst observed on 1997 May 12. The superimposed red boxes highlight the fundamental (F) and harmonic (H) split bands under study.
Current usage metrics show cumulative count of Article Views (full-text article views including HTML views, PDF and ePub downloads, according to the available data) and Abstracts Views on Vision4Press platform.
Data correspond to usage on the plateform after 2015. The current usage metrics is available 48-96 hours after online publication and is updated daily on week days.
Initial download of the metrics may take a while.