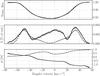
Fig. 11
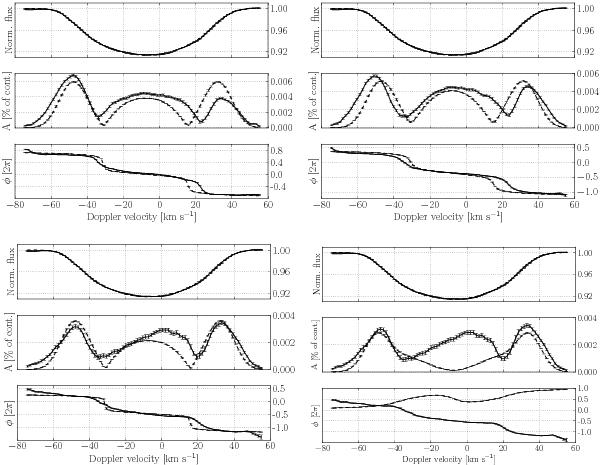
Results of the mode identification by means of the pixel-by-pixel method for the three (out of four) frequencies detected in the spectra of HD 189631: f1 (top left), f2 (top right), and f4 (bottom). The bottom-left and bottom-right panels stand for the (l,m) = (1,1) and (l,m) = (2, − 2) identifications, respectively. The solid and dashed lines stand for the observations (LSD spectra) and the (famias) model, respectively. The frequency values and their identifications are listed in Table 5.
Current usage metrics show cumulative count of Article Views (full-text article views including HTML views, PDF and ePub downloads, according to the available data) and Abstracts Views on Vision4Press platform.
Data correspond to usage on the plateform after 2015. The current usage metrics is available 48-96 hours after online publication and is updated daily on week days.
Initial download of the metrics may take a while.