Fig. 6
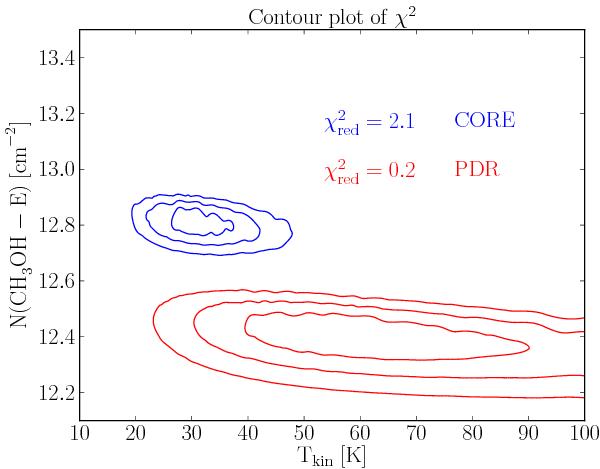
χ2 as a function of N(CH3OH − E) and Tkin for the PDR (red) and dense-core (blue) positions. The H2 density was kept constant to n(H2) = 6 × 104 cm-3 (PDR) and n(H2) = 1 × 105 cm-3 (dense core). The contours indicate the 1, 2, and 3σ confidence levels for the models. The reduced χ2, defined as  , is shown for the best-fit model at each position.
Current usage metrics show cumulative count of Article Views (full-text article views including HTML views, PDF and ePub downloads, according to the available data) and Abstracts Views on Vision4Press platform.
Data correspond to usage on the plateform after 2015. The current usage metrics is available 48-96 hours after online publication and is updated daily on week days.
Initial download of the metrics may take a while.