Free Access
Fig. 1
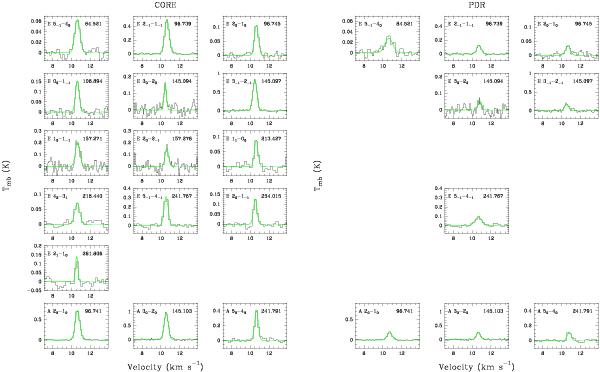
Detected CH3OH lines toward the dense-core (left) and PDR (right) positions. The green curves are Gaussian fits. The line frequency in GHz is given in each box. For each line, the same scale is used at both positions to facilitate the comparison.
This figure is made of several images, please see below:
Current usage metrics show cumulative count of Article Views (full-text article views including HTML views, PDF and ePub downloads, according to the available data) and Abstracts Views on Vision4Press platform.
Data correspond to usage on the plateform after 2015. The current usage metrics is available 48-96 hours after online publication and is updated daily on week days.
Initial download of the metrics may take a while.