Fig. 9
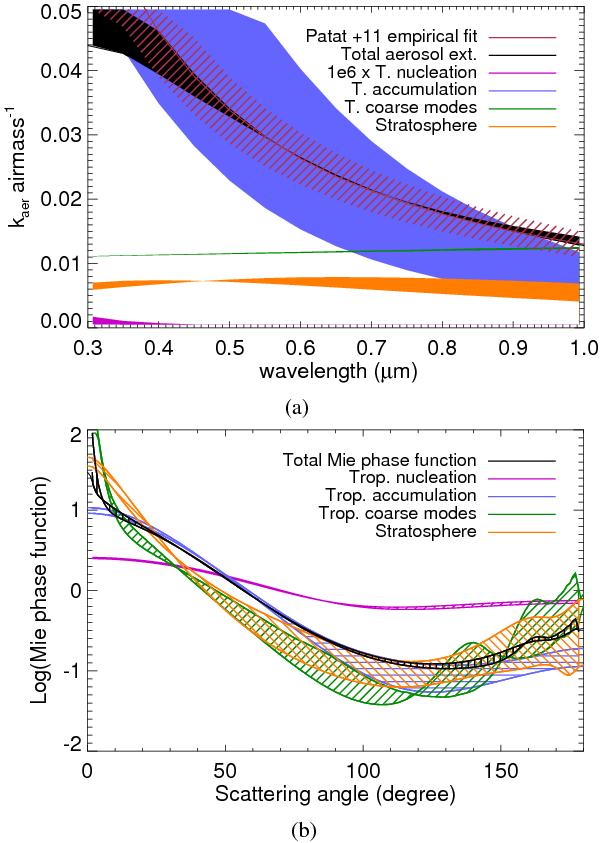
Different properties of the various types of aerosols. In both plots the width of the line is due to the uncertainty of the refractive index (N ranges between 1.3 and 1.5). a) Shows the extinction coefficient of Mie Scattering at 500 nm. The range for the total Mie extinction curve are given by the following values for tropospheric nucleation, accumulation, and coarse, and stratospheric modes, respectively: 100, 100, 60, and 60% for N = 1.3 and 100, 45, 5, and 100% for N = 1.5. The latter is what we have used for the analysis. Also plotted is the Patat et al. (2011) fit with the reported errors. The total Mie extinction curve (after scaling the various components) is in good agreement with the fit in the optical regime. b) This shows the Mie phase functions for the different modes and the total Mie phase function. See Sect. 2.6 for more details.
Current usage metrics show cumulative count of Article Views (full-text article views including HTML views, PDF and ePub downloads, according to the available data) and Abstracts Views on Vision4Press platform.
Data correspond to usage on the plateform after 2015. The current usage metrics is available 48-96 hours after online publication and is updated daily on week days.
Initial download of the metrics may take a while.