Fig. 1
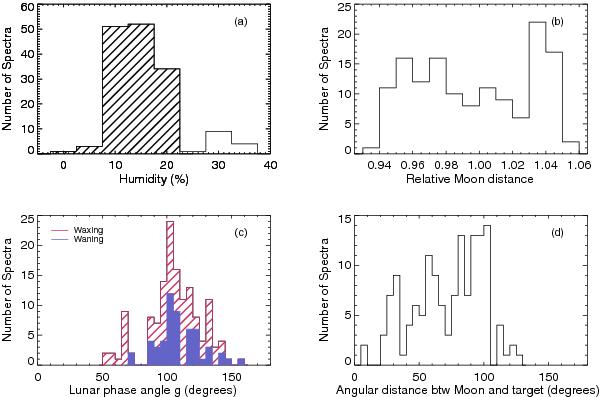
Properties of the FORS1 data from Patat (2008). The data shown has been preselected to not have any clouds during observation and plots b), c), and d) also have ≤ 20% humidity. a) The distribution of the amount of humidity at the time of observation as given by ESO Ambient Conditions Database. Only observations with ≤ 20% humidity were analyzed and is shown here as the filled in part of the histogram. b) Shows the distribution of the relative moon distance. A moon distance of 1 corresponds to the average moon distance of 384 400 km. c) Here we have plotted the distribution of lunar phase angles g. Over-plotted is the number of spectra taken during a waxing and waning Moon, which effects the solar selenographic longitude. d) The distribution of the angular distance between the Moon and target observation ρ is displayed. See Sect. 2.1 for more details.
Current usage metrics show cumulative count of Article Views (full-text article views including HTML views, PDF and ePub downloads, according to the available data) and Abstracts Views on Vision4Press platform.
Data correspond to usage on the plateform after 2015. The current usage metrics is available 48-96 hours after online publication and is updated daily on week days.
Initial download of the metrics may take a while.