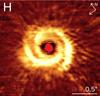
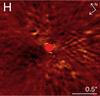
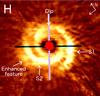
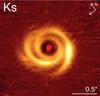
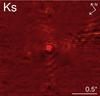
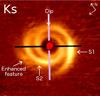
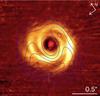
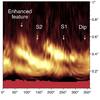
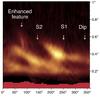
Fig. 1
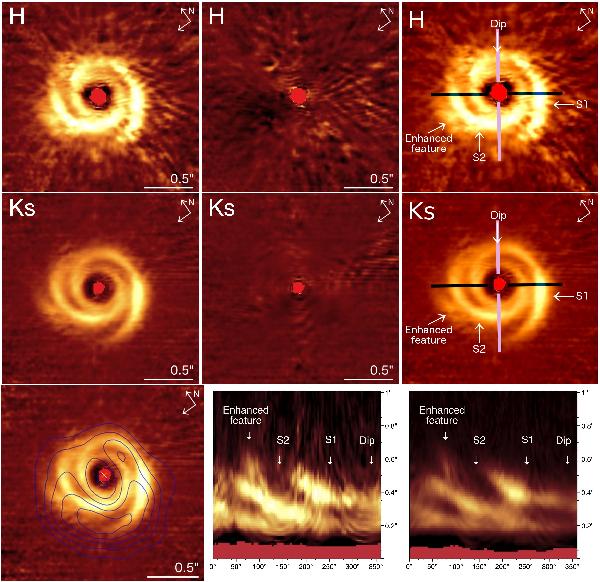
Reflection nebulosity around SAO 206462. First two rows, from left to right: P⊥ image, P∥ image, and P⊥ image with blue and pink stripes indicating the position of the major and minor axis, respectively. The first row is H band, the second is Ks band. Third row, from left to right: comparison between the P⊥ image in Ks band and continuum emission from sub-mm observations by Brown et al. (2009), polar mapping of H and Ks band with angles measured with respect to north. Images are upscaled by a factor 3 to minimize smoothing effects throughout the sub-pixel data shifting and are scaled with r2 to compensate for stellar light dilution. The color scale is linear and arbitrary. The red central region indicates the area on the detector with non-linear pixels. Continuum contours are drawn at 3σ intervals starting from 3σ.
Current usage metrics show cumulative count of Article Views (full-text article views including HTML views, PDF and ePub downloads, according to the available data) and Abstracts Views on Vision4Press platform.
Data correspond to usage on the plateform after 2015. The current usage metrics is available 48-96 hours after online publication and is updated daily on week days.
Initial download of the metrics may take a while.