Fig. 9
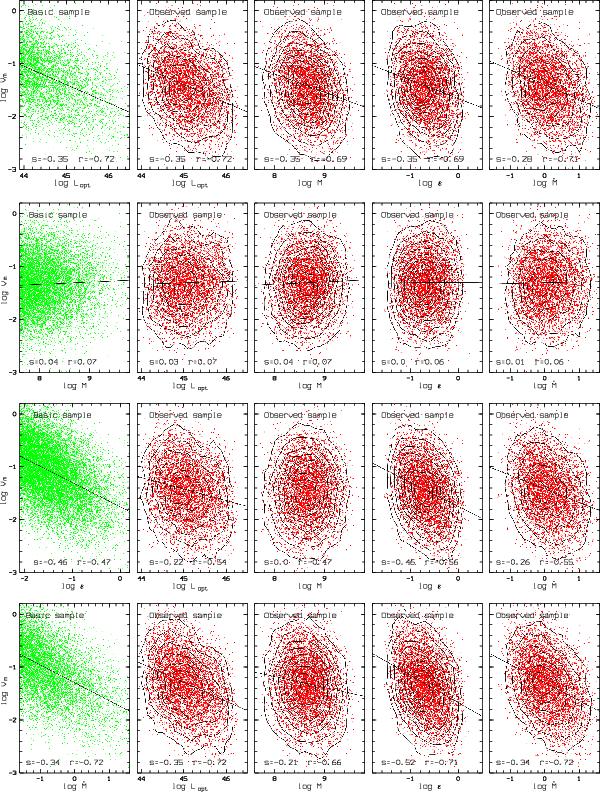
Variability estimator Vm versus Lopt,M,ε, and Ṁ for the simulated quasar sample. In each row, the left panel shows the input correlation in the basic sample, the other diagrams show the expected correlations in the “observed” simulated sample with density contours over-plotted. The two numbers close to the bottom of each panel are the slope (s) and the regression coefficient (r) from the linear regression (solid).
Current usage metrics show cumulative count of Article Views (full-text article views including HTML views, PDF and ePub downloads, according to the available data) and Abstracts Views on Vision4Press platform.
Data correspond to usage on the plateform after 2015. The current usage metrics is available 48-96 hours after online publication and is updated daily on week days.
Initial download of the metrics may take a while.