Free Access
Fig. 7
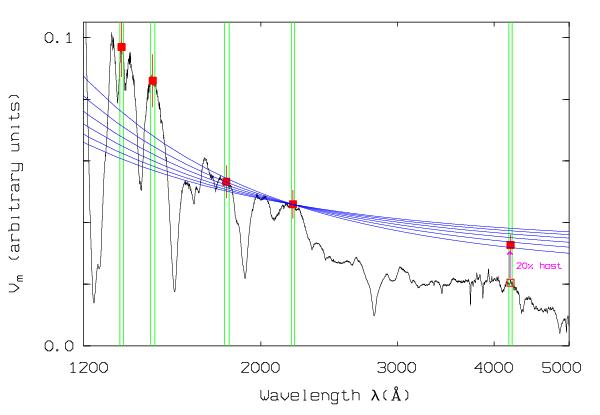
Magnitude variance Vm as a function of wavelength (black structured curve) compared with the predictions from the MTBB models from Fig. 1 (smooth curves). Filled squares with error bars: mean observed Vm (host corrected at λ > 4000 Å) in the continuum windows (vertical lines).
Current usage metrics show cumulative count of Article Views (full-text article views including HTML views, PDF and ePub downloads, according to the available data) and Abstracts Views on Vision4Press platform.
Data correspond to usage on the plateform after 2015. The current usage metrics is available 48-96 hours after online publication and is updated daily on week days.
Initial download of the metrics may take a while.