Fig. 3
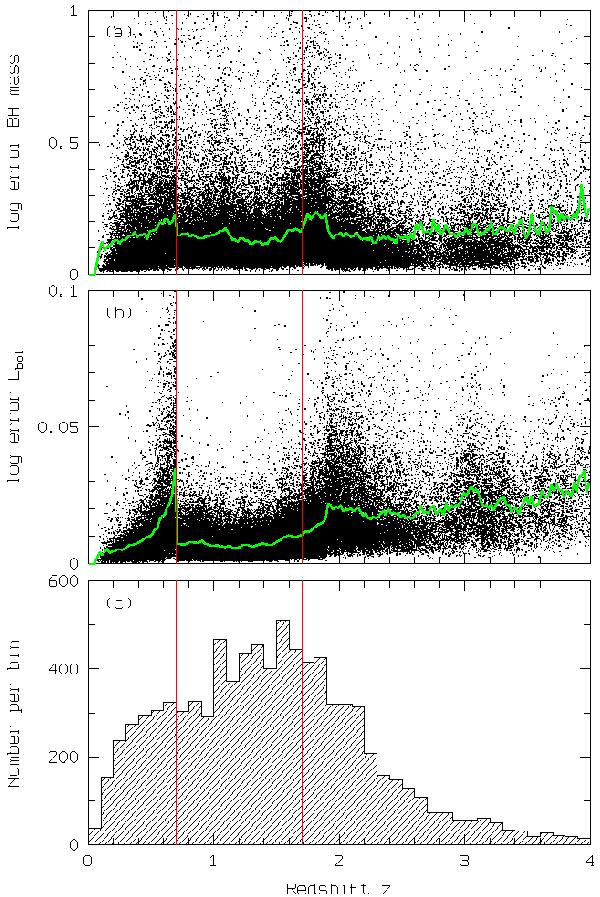
Errors of Ma) and Lbolb) as a function of redshift z for the 105 quasars from Shen et al. (2011). Polygon: mean values in narrow z bins. Bottom c): z distribution of the quasars from the variability sample from Paper I. Vertical lines: z interval of the final quasar sample. For reasons of clarity, we refrain from plotting very large errors in a) and b).
Current usage metrics show cumulative count of Article Views (full-text article views including HTML views, PDF and ePub downloads, according to the available data) and Abstracts Views on Vision4Press platform.
Data correspond to usage on the plateform after 2015. The current usage metrics is available 48-96 hours after online publication and is updated daily on week days.
Initial download of the metrics may take a while.