Free Access
Fig. 2
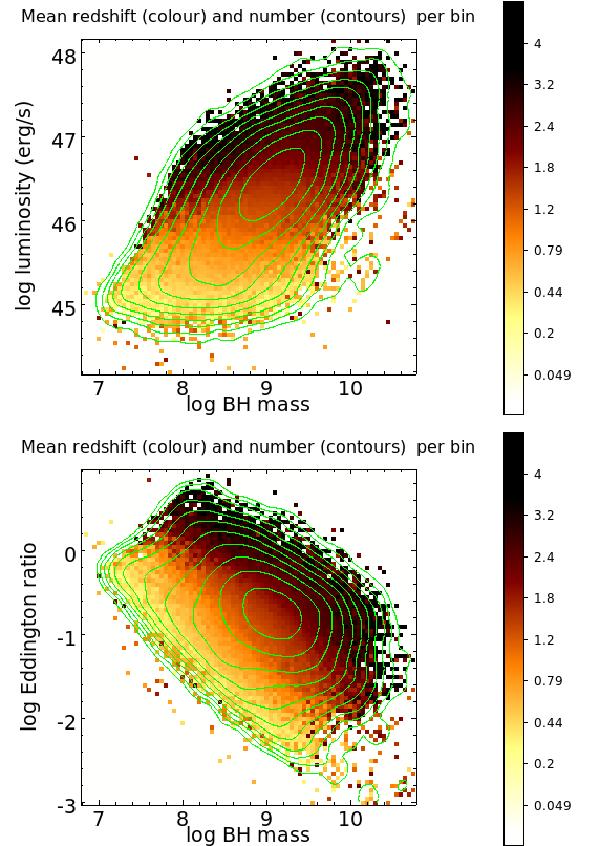
Bolometric luminosity Lbol (top) and Eddington ratio ε (bottom) versus BH mass M (M⊙) for the more than 105 quasars from Shen et al. (2011). The colour coding indicates the redshift z. The number distribution of the quasars is marked by the contour curves.
This figure is made of several images, please see below:
Current usage metrics show cumulative count of Article Views (full-text article views including HTML views, PDF and ePub downloads, according to the available data) and Abstracts Views on Vision4Press platform.
Data correspond to usage on the plateform after 2015. The current usage metrics is available 48-96 hours after online publication and is updated daily on week days.
Initial download of the metrics may take a while.