Fig. 2
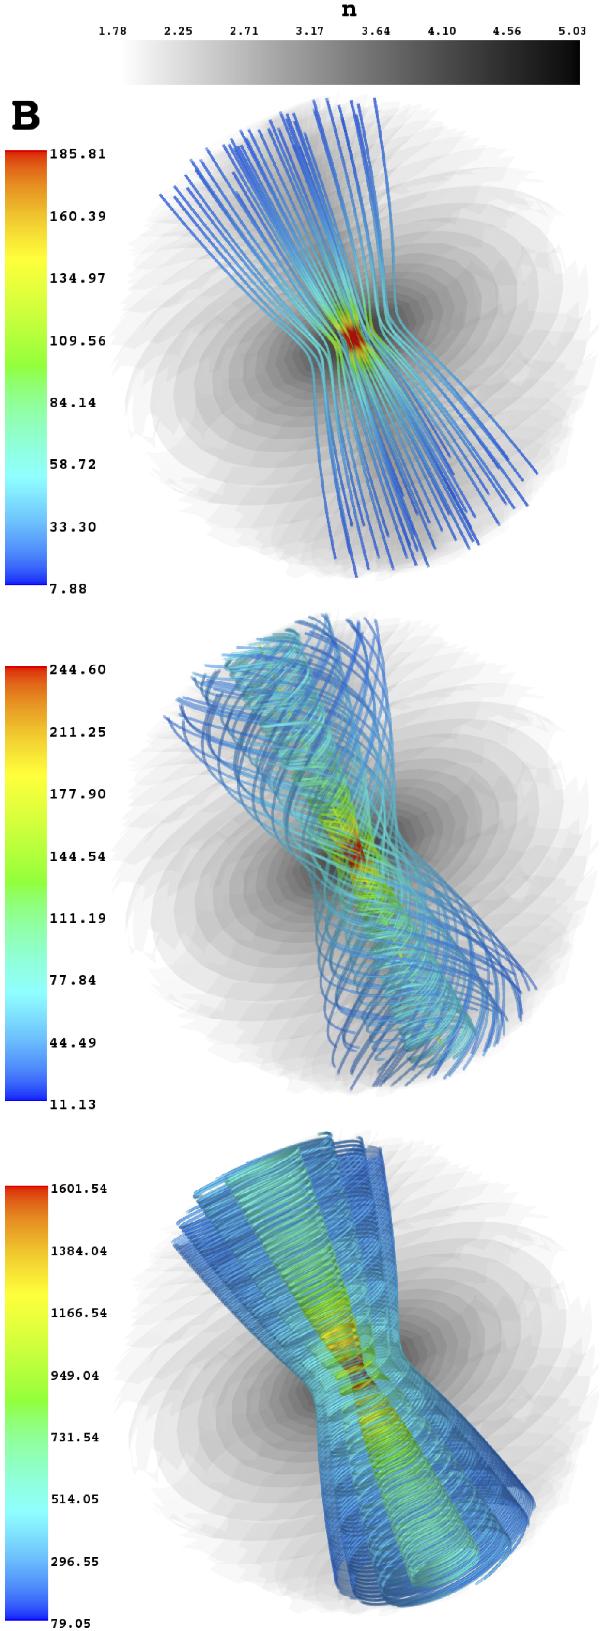
Magnetic field lines of the λ = 2.66 toroid with b0 = 0 (purely poloidal, upper plot), b0 = 1 (middle plot), and b0 = 10 (lower plot). Iso-density contours are shown in grey scales in unit of cm-3 in logarithmic scale, while the magnetic field module is shown in colour scale in unit of μG. Field line plots are generated using the visualisation software package MAYAVI (Ramachandran & Varoquaux 2011).
Current usage metrics show cumulative count of Article Views (full-text article views including HTML views, PDF and ePub downloads, according to the available data) and Abstracts Views on Vision4Press platform.
Data correspond to usage on the plateform after 2015. The current usage metrics is available 48-96 hours after online publication and is updated daily on week days.
Initial download of the metrics may take a while.