Free Access
Fig. 3
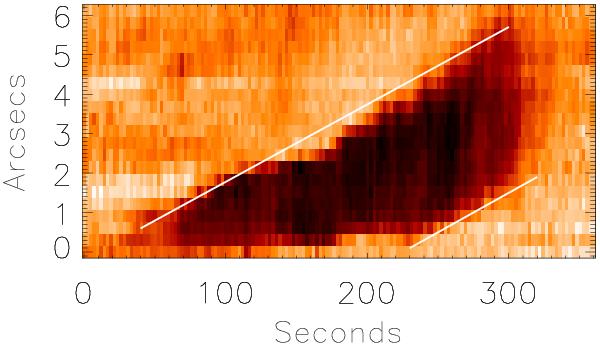
Time-distance plot showing the apparent horizontal velocity of this event. White lines are over-plotted and are used to calculate the gradient of the motion, and hence the velocity within the Hα blue wing. The slit position is shown in Fig. 2.
Current usage metrics show cumulative count of Article Views (full-text article views including HTML views, PDF and ePub downloads, according to the available data) and Abstracts Views on Vision4Press platform.
Data correspond to usage on the plateform after 2015. The current usage metrics is available 48-96 hours after online publication and is updated daily on week days.
Initial download of the metrics may take a while.