Fig. 7
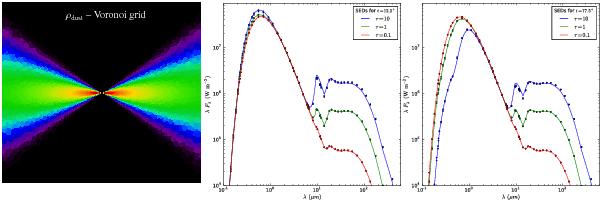
Illustration of the results for the Pascucci benchmark (Pascucci et al. 2004). The left panel shows a cut through the central edge-on plane of the dust density distribution discretized on a 3D Voronoi grid with one million cells randomly placed according to a 1/r distribution. The other panels show the simulated spectral energy distribution (SED) for disk inclinations equal to 12.5° (center) and 77.5° (right), for optical depths τ = 0.1,1, and 10. Dots indicate benchmark reference points; solid lines represent our simulation results using the 3D Voronoi grid shown in the left panel.
Current usage metrics show cumulative count of Article Views (full-text article views including HTML views, PDF and ePub downloads, according to the available data) and Abstracts Views on Vision4Press platform.
Data correspond to usage on the plateform after 2015. The current usage metrics is available 48-96 hours after online publication and is updated daily on week days.
Initial download of the metrics may take a while.