Fig. 4
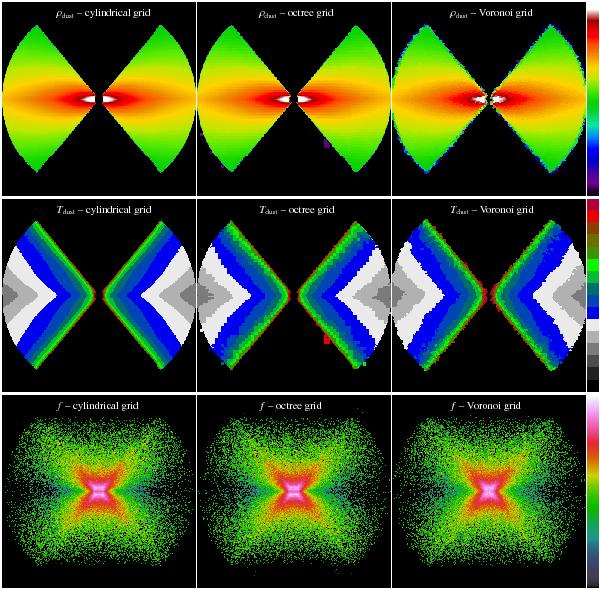
Illustration of the results for the torus model with three different dust grids. Rows – top: the dust density distribution (cut through the central edge-on plane); middle: the calculated dust temperature (cut through the central edge-on plane); bottom: the calculated flux density escaping from the model (edge-on view). Columns – left: regular 2D cylindrical grid with 2502 = 62 500 cells; middle: adaptive octree grid with ≈ 950 000 cells; right: Voronoi grid with ≈ 950 000 uniformly distributed cells.
Current usage metrics show cumulative count of Article Views (full-text article views including HTML views, PDF and ePub downloads, according to the available data) and Abstracts Views on Vision4Press platform.
Data correspond to usage on the plateform after 2015. The current usage metrics is available 48-96 hours after online publication and is updated daily on week days.
Initial download of the metrics may take a while.