Free Access
Fig. 2
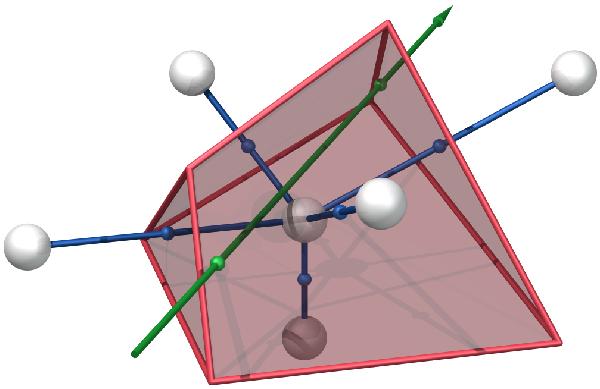
A single Voronoi cell (in red) with its neighboring sites (in gray) and corresponding Delaunay edges (in blue). A straight path through the cell is shown (in green) with its intersection points with the cell boundary at entry and exit.
Current usage metrics show cumulative count of Article Views (full-text article views including HTML views, PDF and ePub downloads, according to the available data) and Abstracts Views on Vision4Press platform.
Data correspond to usage on the plateform after 2015. The current usage metrics is available 48-96 hours after online publication and is updated daily on week days.
Initial download of the metrics may take a while.