Fig. 3
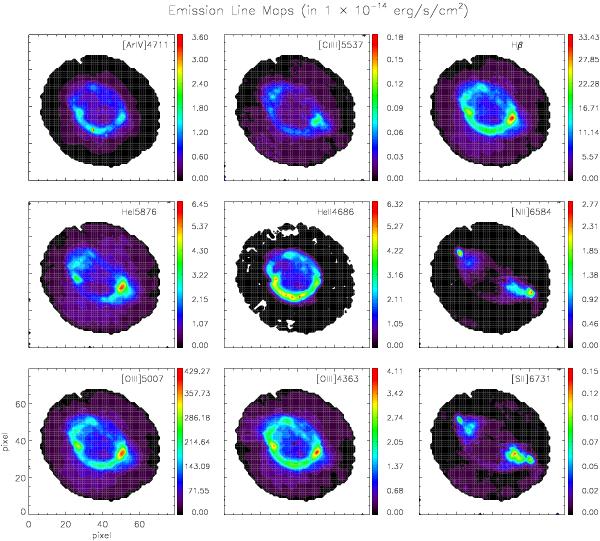
Emission-line maps for the most important lines observed with VIMOS-IFU. From top to bottom and left to right, they are [Ar iv] 4711 Å; [Cl iii] 5537 Å; Hβ; He i 5876 Å; He ii 4686 Å; [N ii] 6584 Å; [O iii] 5007 Å; [O iii] 4363 Å; and [S ii] 6731 Å. The orientation in the sky and the plate scale is the same as in Fig. 1. The intensity scale is normalised to the maximum value for each emission line.
Current usage metrics show cumulative count of Article Views (full-text article views including HTML views, PDF and ePub downloads, according to the available data) and Abstracts Views on Vision4Press platform.
Data correspond to usage on the plateform after 2015. The current usage metrics is available 48-96 hours after online publication and is updated daily on week days.
Initial download of the metrics may take a while.