Fig. 2
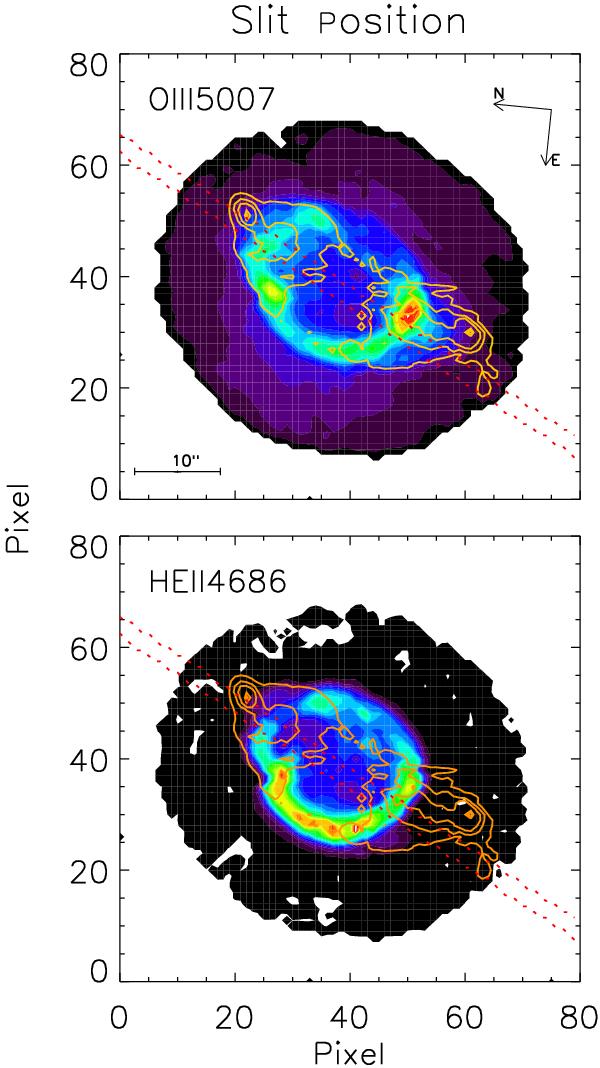
Line-emission maps for [O iii] λ5007 (top) and Heiiλ4686 (bottom) showing the position of the long-slit observations used for the flux calibration of the data (red dotted lines). The orientation in the sky as well as the plate scale is also indicated in the top map. The contours overlaid in both figures are of the [N ii]6584 line-emission map. In the maps above the intensity scale is normalised to the maximum value for each emission line.
Current usage metrics show cumulative count of Article Views (full-text article views including HTML views, PDF and ePub downloads, according to the available data) and Abstracts Views on Vision4Press platform.
Data correspond to usage on the plateform after 2015. The current usage metrics is available 48-96 hours after online publication and is updated daily on week days.
Initial download of the metrics may take a while.