Fig. 9
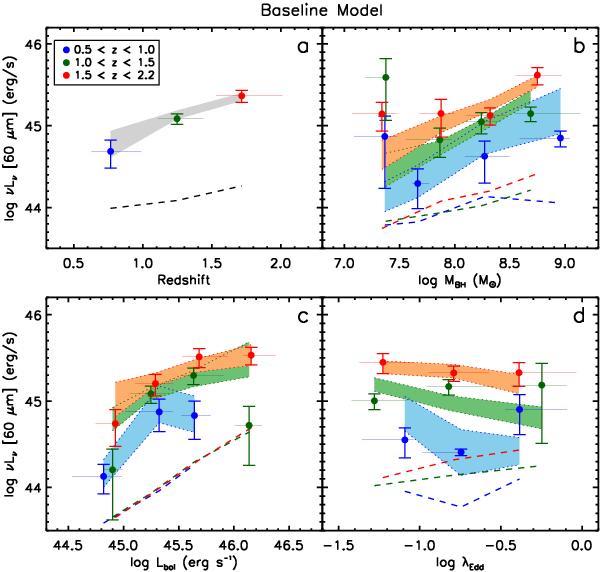
Comparison between the measured mean L60 and the predictions of a baseline model that, through a simple bootstrap analysis, takes into account some of the selection effects built into the QSO sample (see Sect. 6.1 for details). AGNs in the 0.5 < z < 1.0, 1.0 < z < 1.5, and 1.5 < z < 2.2 redshift bins are represented by blue, green, and red colors, respectively. The four panels show measurements as colored dots with error bars, in a) bins of redshift only, b) bins of MBH and redshift, c) bins of Lbol and redshift, and d) bins of λE and redshift. The x-axis error bars are not uncertainties, but a range in the abscissa that encompasses 80% of the sample in the corresponding bin. Dashed lines show the expected contribution to the FIR luminosity from pure AGN-heated dust. The shaded polygons show the baseline model predictions for the trends: gray for panel a) and blue/green/red in the other three panels representing the three redshift bins according to the key in a). The y-axis width of the polygons gives the 1σ uncertainty on the mean model trends, determined by the intrinsic scatter of the model QSO host population and the size of each subsample. In all panels, the form of the trends and the uncertainties on the measurements are reproduced reasonably well by the baseline model, especially in bins with more than ten objects.
Current usage metrics show cumulative count of Article Views (full-text article views including HTML views, PDF and ePub downloads, according to the available data) and Abstracts Views on Vision4Press platform.
Data correspond to usage on the plateform after 2015. The current usage metrics is available 48-96 hours after online publication and is updated daily on week days.
Initial download of the metrics may take a while.