Fig. 6
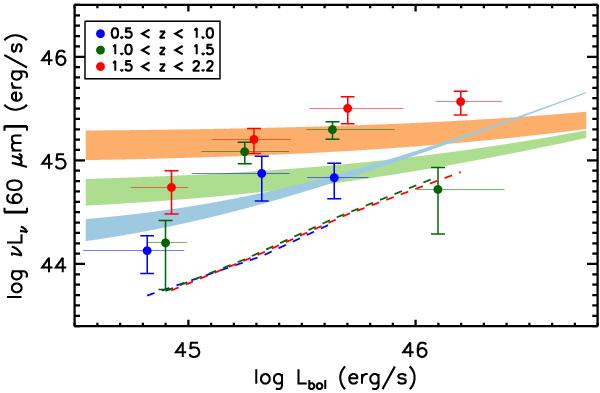
Mean L60 of QSOs as a function of AGN bolometric luminosity Lbol, shown as colored dots with error bars. AGNs in the 0.5 < z < 1.0, 1.0 < z < 1.5, and 1.5 < z < 2.2 redshift bins are represented by blue, green, and red colors, respectively. The x-axis error bars show the range in Lbol that encompasses 80% of the sample in the corresponding bolometric luminosity bin. Dashed lines show the expected contribution to the FIR luminosity from pure AGN-heated dust (Eq. (1)). The lightly shaded colored polygons show the mean L60 trends for X-ray AGNs from the fits in Rosario et al. (2012). The difference in the shape of the trends between X-ray AGNs and QSOs can be attributed to selection biases in the sample (see Sect. 5.2 for details).
Current usage metrics show cumulative count of Article Views (full-text article views including HTML views, PDF and ePub downloads, according to the available data) and Abstracts Views on Vision4Press platform.
Data correspond to usage on the plateform after 2015. The current usage metrics is available 48-96 hours after online publication and is updated daily on week days.
Initial download of the metrics may take a while.