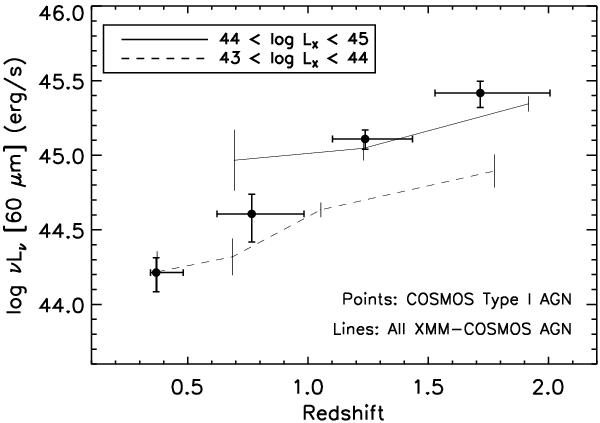
Fig. 4

Mean 60 μm luminosity L60 of QSOs in COSMOS as a function of redshift, shown as solid dots with error bars. The x-axis error bars show the range in redshift that encompasses 80% of the sample in the respective redshift bin. The solid and dashed lines show the mean trends for AGNs from the XMM-COSMOS survey (Brusa et al. 2010) in two bins in instrinsic 2–10 keV X-ray luminosity. Vertical error bars placed at intervals on these lines show the 1σ scatter in these trends.
Current usage metrics show cumulative count of Article Views (full-text article views including HTML views, PDF and ePub downloads, according to the available data) and Abstracts Views on Vision4Press platform.
Data correspond to usage on the plateform after 2015. The current usage metrics is available 48-96 hours after online publication and is updated daily on week days.
Initial download of the metrics may take a while.


