Fig. 10
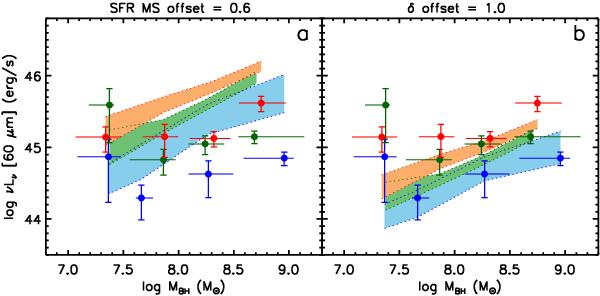
Comparison between the measured mean L60 in bins of MBH and the predictions of two simple alternative models for BLAGN host properties. a) All BLAGNs are assumed to lie in starbursts which have at a mean positive offset of 0.6 dex in SFR from the SF Mass Sequence, or b) the MBH–M∗ relation evolves with redshift according to Eq. (2) with δ = 1.0. The measurements are shown as colored points with error bars. AGNs in the 0.5 < z < 1.0, 1.0 < z < 1.5, and 1.5 < z < 2.2 redshift bins are represented by blue, green, and red colors, respectively. The x-axis error bars show the range in the MBH that encompasses 80% of the sample in the corresponding bin. Neither set of parameters chosen here fit the data as well as the “baseline model” (Sect. 6.1). While model a) performs very poorly in fitting the data, model b) is marginally acceptable, though smaller values of δ are preferred.
Current usage metrics show cumulative count of Article Views (full-text article views including HTML views, PDF and ePub downloads, according to the available data) and Abstracts Views on Vision4Press platform.
Data correspond to usage on the plateform after 2015. The current usage metrics is available 48-96 hours after online publication and is updated daily on week days.
Initial download of the metrics may take a while.