Fig. 8
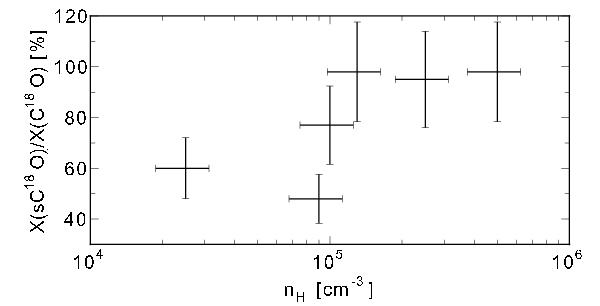
Correlation of C18O freezeout and hydrogen density in the core centers. The horizontal error bars on the hydrogen density represent the fitting uncertainty of the ray-tracing modeling (i.e., excluding systematic uncertainties from, e.g., the dust opacity model; see Sect. 3.1). The vertical error bars represent a 20% uncertainty in the amount of icy CO in the chemical model.
Current usage metrics show cumulative count of Article Views (full-text article views including HTML views, PDF and ePub downloads, according to the available data) and Abstracts Views on Vision4Press platform.
Data correspond to usage on the plateform after 2015. The current usage metrics is available 48-96 hours after online publication and is updated daily on week days.
Initial download of the metrics may take a while.