Fig. 7
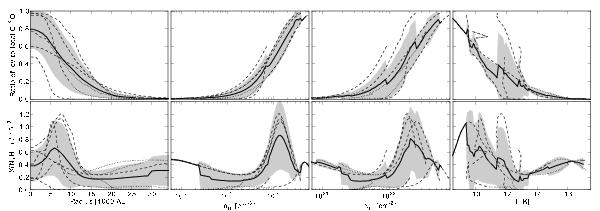
Top row: the ratio of icy-to-total C18O abundance of the best-fit models is plotted against the core radius, the hydrogen number density, the column density, and the dust temperature. Bottom row: the N2H+ abundance (relative to the hydrogen density) is plotted against the same quantities. The dashed lines indicate the results of the individual globules. Where the models cannot be compared to observations (because the line radiation is too weak), the dashed lines turn into dotted lines. The bold solid lines mark the mean values. The gray area indicates one standard deviation.
Current usage metrics show cumulative count of Article Views (full-text article views including HTML views, PDF and ePub downloads, according to the available data) and Abstracts Views on Vision4Press platform.
Data correspond to usage on the plateform after 2015. The current usage metrics is available 48-96 hours after online publication and is updated daily on week days.
Initial download of the metrics may take a while.