Fig. 6
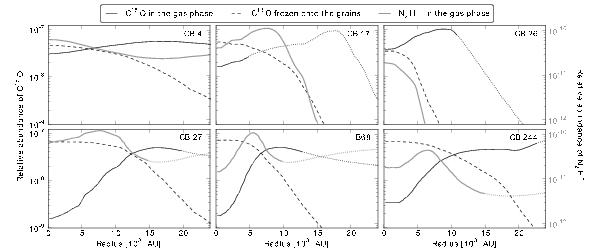
Relative abundances (absolute molecular density with respect to the hydrogen density) of gaseous C18O (black solid line), frozen-out C18O (dashed black line) and gaseous N2H+ (gray solid line) in the final models. At the outer radii of the emission profiles derived from the observations, the lines turn from a solid into a dotted line shape, indicating that these parts of the profiles are not constrained by observations.
Current usage metrics show cumulative count of Article Views (full-text article views including HTML views, PDF and ePub downloads, according to the available data) and Abstracts Views on Vision4Press platform.
Data correspond to usage on the plateform after 2015. The current usage metrics is available 48-96 hours after online publication and is updated daily on week days.
Initial download of the metrics may take a while.