Fig. 5
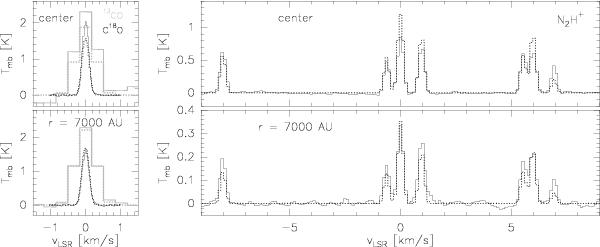
To quantify the agreement of models and observations we compare the spectra over the full radius of the models. Here, an example of B 68 is shown. The solid lines represent observations, the dotted lines the synthetic spectra of the best models. On the left panels, we show the spectra of the 13CO (J = 2−1) (gray) and C18O (J = 2−1) (black) transitions. On the right panels, we show the spectra of the N2H+ (J = 1−0) transition. The top line shows the spectra at the position of the core center, the bottom line the spectra at a radial distance of 7000 AU.
Current usage metrics show cumulative count of Article Views (full-text article views including HTML views, PDF and ePub downloads, according to the available data) and Abstracts Views on Vision4Press platform.
Data correspond to usage on the plateform after 2015. The current usage metrics is available 48-96 hours after online publication and is updated daily on week days.
Initial download of the metrics may take a while.