Fig. C.1
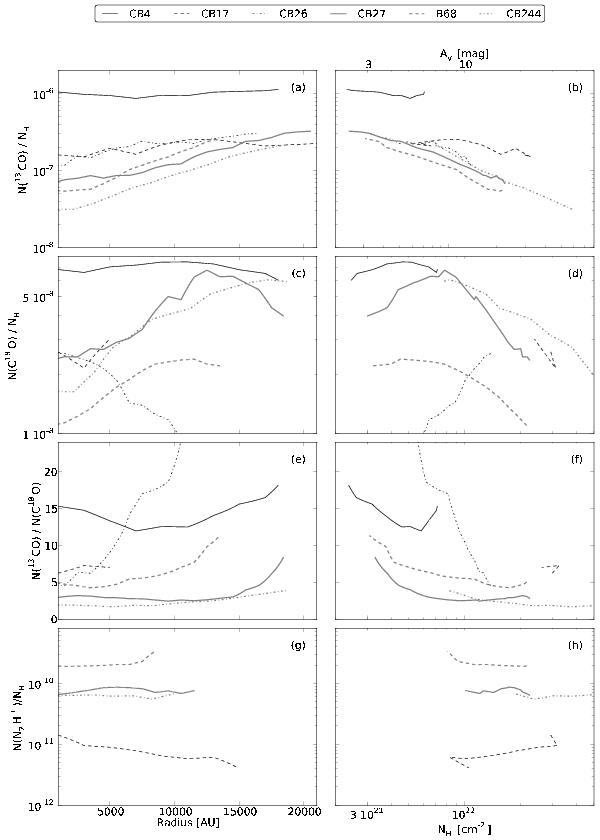
Results from the LTE-analysis. Plotted are a) the relative column densities of 13CO against radius b) and against the hydrogen column density, c) the relative column densities of C18O against radius d) and against the hydrogen column density, e) the ratios of N(13CO)/N(C18O) are plotted against radius f) and against the hydrogen column density, g) the relative column densities of N2H+against radius, h) and against the hydrogen column density. The column densities of N2H+ in CB 4 and CB 26 could not be derived, since the emission in these globules is too weak and so are missing in the plots.
Current usage metrics show cumulative count of Article Views (full-text article views including HTML views, PDF and ePub downloads, according to the available data) and Abstracts Views on Vision4Press platform.
Data correspond to usage on the plateform after 2015. The current usage metrics is available 48-96 hours after online publication and is updated daily on week days.
Initial download of the metrics may take a while.