Fig. 2
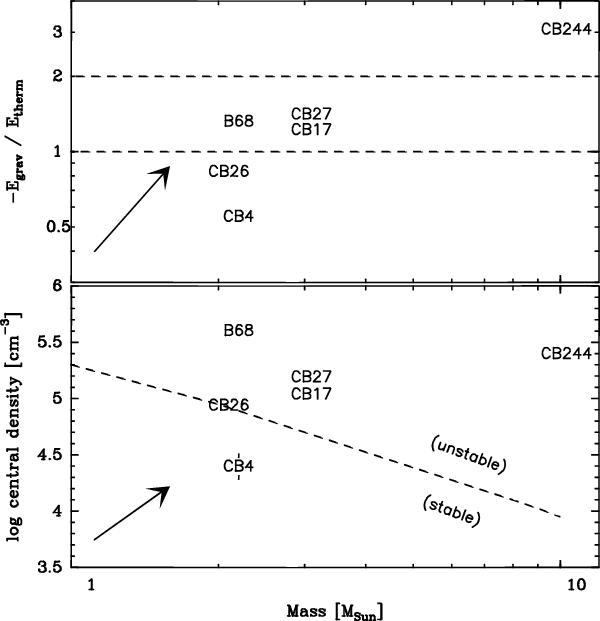
Stability of the cores. Same plot as Fig. 6 in Launhardt et al. (2013), but here for the results of the ray-tracing models. Top: ratio of gravitational potential to thermal kinetic energy vs. total gas mass (Mcore). The lower dashed horizontal line marks the bounding limit of −Egrav/Etherm = 1, while the upper line marks the state of virialization at −Egrav/Etherm = 2. Bottom: central density vs. total gas mass for the same cores. The dashed line marks the maximum stable density of a pressure-supported, self-gravitating modified (nonisothermal) BES as calculated by Keto & Caselli (2008, with their Fig. 14, model with photoelectric heating at the core boundary taken into account). The uncertainty resulting from the ray-tracing modeling is indicated by the error bars at CB 4. The arrows indicate the maximum systematic shift of the cores in the diagram if grain properties of ISM dust were used in the modeling.
Current usage metrics show cumulative count of Article Views (full-text article views including HTML views, PDF and ePub downloads, according to the available data) and Abstracts Views on Vision4Press platform.
Data correspond to usage on the plateform after 2015. The current usage metrics is available 48-96 hours after online publication and is updated daily on week days.
Initial download of the metrics may take a while.