Fig. 10
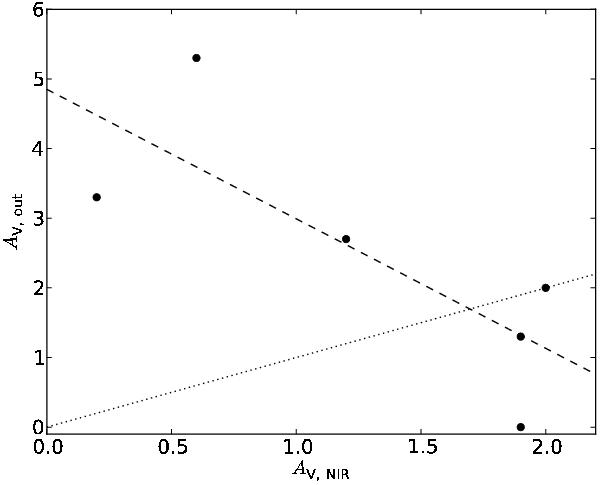
We plot the parameters Av, out of the best models over the measured values of Av, NIR from the NIR extinction maps. The dashed line is a linear fit to the data points, which is only meant to illustrate the trend. The dotted line indicates Av, out = Av, NIR. We interpret the anti-correlation as an indication of increasing decoupling of gas and dust temperatures towards lower extinction.
Current usage metrics show cumulative count of Article Views (full-text article views including HTML views, PDF and ePub downloads, according to the available data) and Abstracts Views on Vision4Press platform.
Data correspond to usage on the plateform after 2015. The current usage metrics is available 48-96 hours after online publication and is updated daily on week days.
Initial download of the metrics may take a while.