Fig. 3
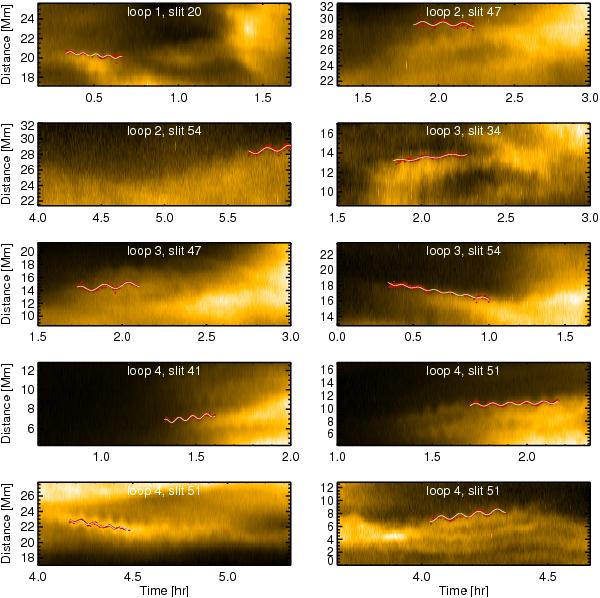
Time-distance maps for the analysed loops at different positions (slit number) along the loop paths. The most noticeable oscillations were fitted with a sine function to define their parameters. Red dots indicate the positions of the loop edge estimated by the Gaussian fitting to the partial derivative of the time-distance plot in transverse direction. The white lines show the best-fitting sinusoidal functions.
Current usage metrics show cumulative count of Article Views (full-text article views including HTML views, PDF and ePub downloads, according to the available data) and Abstracts Views on Vision4Press platform.
Data correspond to usage on the plateform after 2015. The current usage metrics is available 48-96 hours after online publication and is updated daily on week days.
Initial download of the metrics may take a while.