Fig. 2
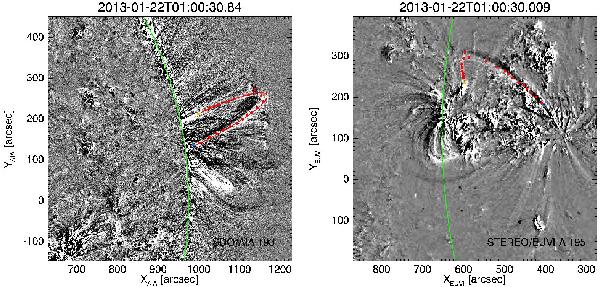
Running difference images of coronal loops. The left panel shows the active region NOAA 11654 from SDO/AIA in the 193 Åband. The right panel shows a running difference image computed from STEREO/EUVI-A observing the same active region in the 195 Åband at the same time, but at a different angle. The green lines in both panels show the position of the limb as seen from SDO. Red solid circles in both panels mark the same points on the loop visible from both spacecraft. A movie showing the temporal evolution between 00:10 and 05:50 UT on 22. Jan. 2013 is available online.
Current usage metrics show cumulative count of Article Views (full-text article views including HTML views, PDF and ePub downloads, according to the available data) and Abstracts Views on Vision4Press platform.
Data correspond to usage on the plateform after 2015. The current usage metrics is available 48-96 hours after online publication and is updated daily on week days.
Initial download of the metrics may take a while.