Fig. 11
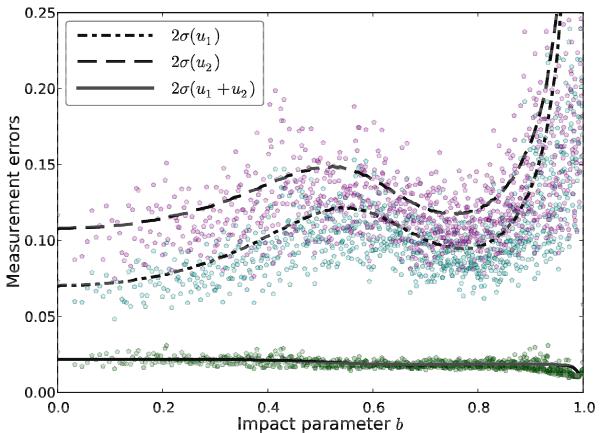
Simulated measurement errors (dots) for the individual LDCs u1 (cyan), u2 (purple) and for the sum u1 + u2 (green) as determined by transit modeling. For the simulation we used fixed parameters only the impact parameter was varied between 0 and 1. The overplotted lines show our analytical solutions (see Appendix B for details).
Current usage metrics show cumulative count of Article Views (full-text article views including HTML views, PDF and ePub downloads, according to the available data) and Abstracts Views on Vision4Press platform.
Data correspond to usage on the plateform after 2015. The current usage metrics is available 48-96 hours after online publication and is updated daily on week days.
Initial download of the metrics may take a while.