Free Access
Table 1
Overview of the diagnostic lines used to derive the projected rotational velocity.
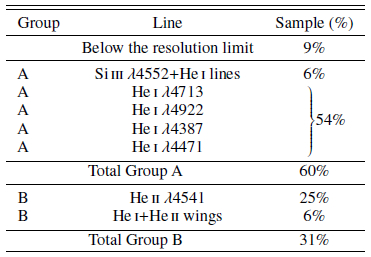
Notes. Group A diagnostics provide the most reliable measurements; those in Group B are of a lesser quality. The last column lists the fraction of our sample for which each diagnostic can be applied.
Current usage metrics show cumulative count of Article Views (full-text article views including HTML views, PDF and ePub downloads, according to the available data) and Abstracts Views on Vision4Press platform.
Data correspond to usage on the plateform after 2015. The current usage metrics is available 48-96 hours after online publication and is updated daily on week days.
Initial download of the metrics may take a while.