Fig. 10
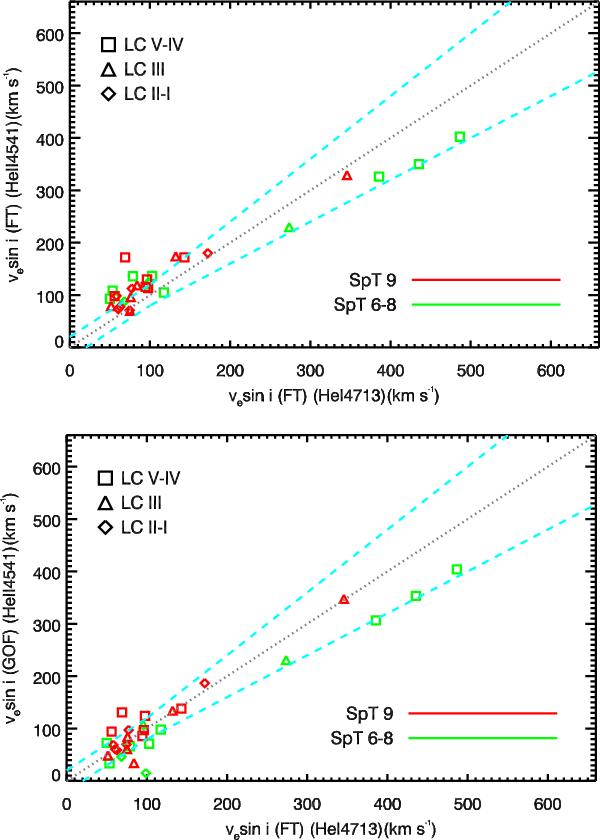
Comparison of νesini measurements from He iλ4713 and He iiλ4541. Upper panel: both diagnostic lines analyzed using the FT method. Lower panel: He iiλ4541 analyzed using the GOF and He iλ4713 using the FT. Information on the LC and SpT of the targets is provided by the symbol shapes and colors. Lines have the same meaning as in Fig. 6.
Current usage metrics show cumulative count of Article Views (full-text article views including HTML views, PDF and ePub downloads, according to the available data) and Abstracts Views on Vision4Press platform.
Data correspond to usage on the plateform after 2015. The current usage metrics is available 48-96 hours after online publication and is updated daily on week days.
Initial download of the metrics may take a while.