Fig. A.1
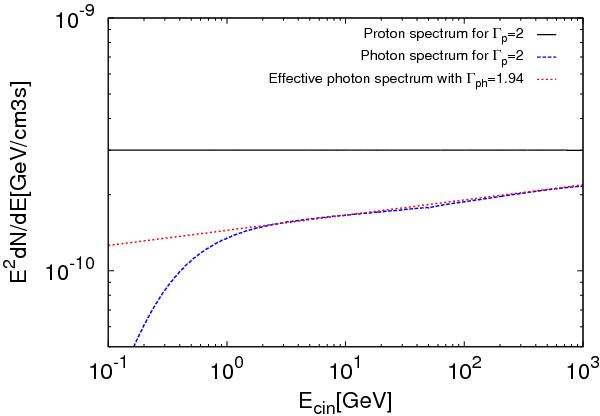
Produced photon spectrum (blue) for a proton injected spectrum of Γp = 2 and Ecut,p = 1015 eV (black, scaled by an arbitrary factor). The red dotted line represents the best fit of the photon spectra with a simple power law in the energy range [1–300] GeV. The behaviour at low energy follows the increase in the cross section at Ep ~ 1 GeV (see Eq. (A.3)). Note that the proton spectrum is expressed as function of the kinetic energy, Ecin = Etot − mpc2, with mp ~ 1 GeV/ c2.
Current usage metrics show cumulative count of Article Views (full-text article views including HTML views, PDF and ePub downloads, according to the available data) and Abstracts Views on Vision4Press platform.
Data correspond to usage on the plateform after 2015. The current usage metrics is available 48-96 hours after online publication and is updated daily on week days.
Initial download of the metrics may take a while.