Free Access
Fig. 2
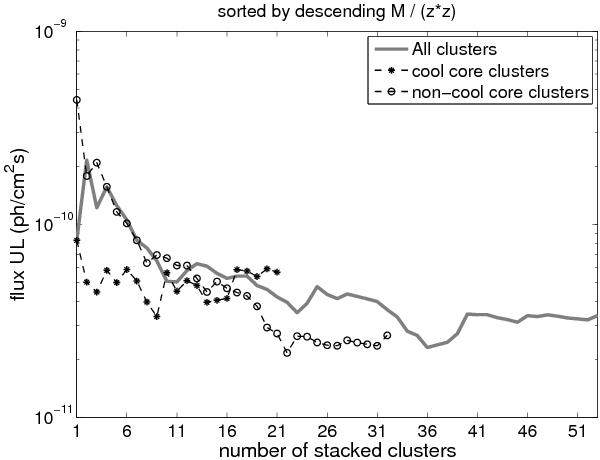
95% CL upper-limits on the average photon flux (SUL/N) in the 1–300 GeV energy band for a potential point-like emission at the centre of the ROIs versus the number of stacked clusters. The stacking analysis is performed using a power-law spectrum with photon index 2.4 and a stacking order of descending M500/z2-values.
Current usage metrics show cumulative count of Article Views (full-text article views including HTML views, PDF and ePub downloads, according to the available data) and Abstracts Views on Vision4Press platform.
Data correspond to usage on the plateform after 2015. The current usage metrics is available 48-96 hours after online publication and is updated daily on week days.
Initial download of the metrics may take a while.