Free Access
Fig. 4
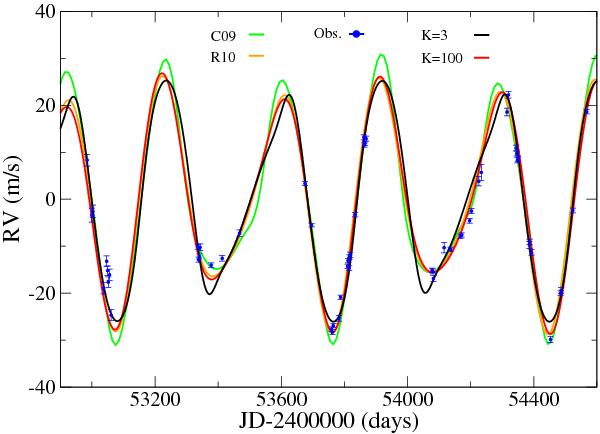
Comparison of different orbital solutions: radial velocity measurements (blue dots), the best fit solution C09 (green line), the R10 simulation (yellow line), and our two solutions with K3 (black line) and K100 (red line). See text for details.
Current usage metrics show cumulative count of Article Views (full-text article views including HTML views, PDF and ePub downloads, according to the available data) and Abstracts Views on Vision4Press platform.
Data correspond to usage on the plateform after 2015. The current usage metrics is available 48-96 hours after online publication and is updated daily on week days.
Initial download of the metrics may take a while.