Fig. 3
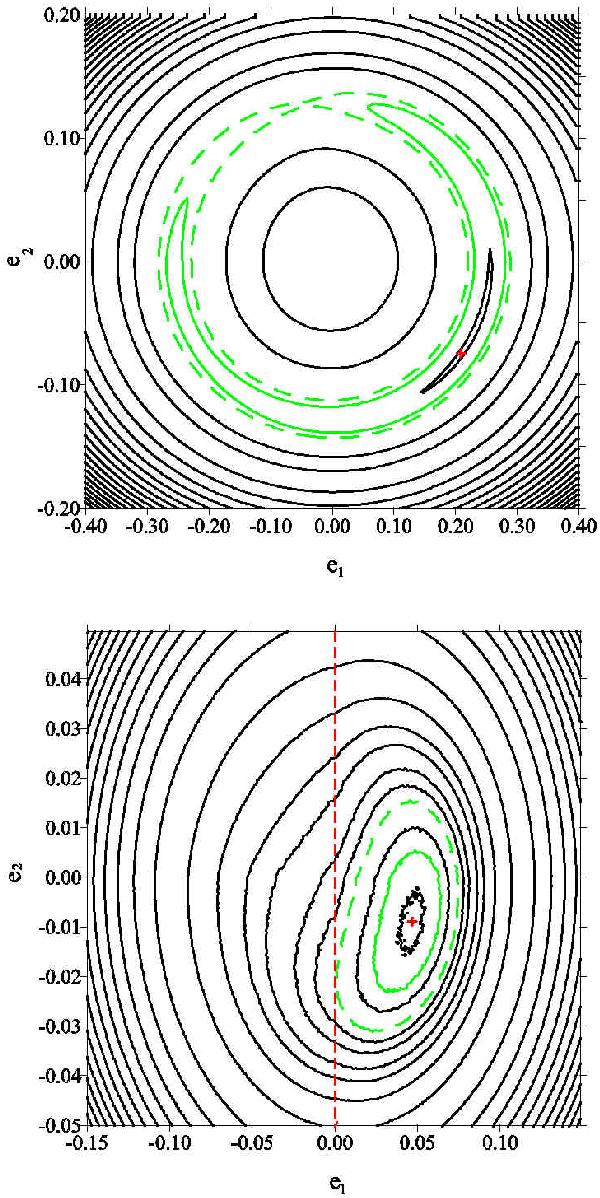
Energy levels of the 3/2 resonant Hamiltonian (1) on the (e1, e2)-plane for the C09 (top) and the R10 solution (bottom). The dashed green lines show the true separatrix (top) and the kinematic transition from oscillations to circulations (bottom). The ACR of each solution is presented with a red symbol, while the corresponding energy level is plotted as a continuous green curve.
Current usage metrics show cumulative count of Article Views (full-text article views including HTML views, PDF and ePub downloads, according to the available data) and Abstracts Views on Vision4Press platform.
Data correspond to usage on the plateform after 2015. The current usage metrics is available 48-96 hours after online publication and is updated daily on week days.
Initial download of the metrics may take a while.