Fig. 12
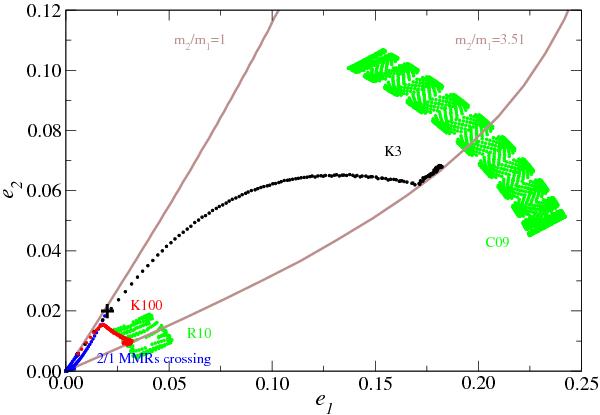
Projections of the C09 and R10 oscillations (green dots) and the K3 and K100 evolutionary paths during the two stages of planet formation/migration on the (e1,e2)-plane. The first stage of accretion includes the passage through the 2/1 MMR and the capture into the 3/2 MMR (blue points). The evolution during the second stage of the runaway mass growth and the type II migration is shown as black dots for the K3 solution and as red dots for the K100 solution. The ACR-families are shown by continuous lines; one is parameterized by m2/m1 = 1, the other by m2/m1 = 3.51. The black cross shows the initial configuration of the planet pair.
Current usage metrics show cumulative count of Article Views (full-text article views including HTML views, PDF and ePub downloads, according to the available data) and Abstracts Views on Vision4Press platform.
Data correspond to usage on the plateform after 2015. The current usage metrics is available 48-96 hours after online publication and is updated daily on week days.
Initial download of the metrics may take a while.