Fig. 10
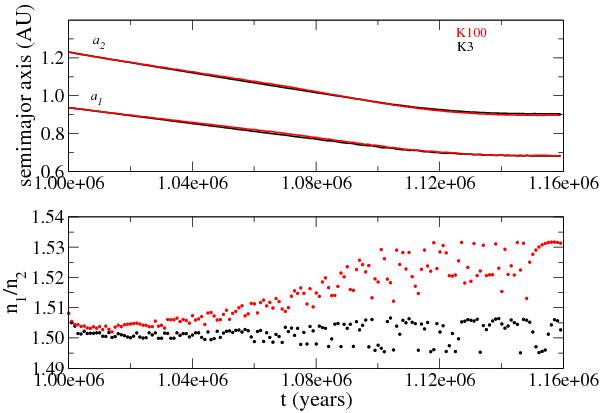
Orbital decay of the HD 45364 planets during the second stage of the planet formation. The top panel shows the evolution of the two semimajor axes, while the bottom panel shows the mean-motion ratio as a function of time. The black dots correspond to the K3 solution and the red dots to the K100 solution.
Current usage metrics show cumulative count of Article Views (full-text article views including HTML views, PDF and ePub downloads, according to the available data) and Abstracts Views on Vision4Press platform.
Data correspond to usage on the plateform after 2015. The current usage metrics is available 48-96 hours after online publication and is updated daily on week days.
Initial download of the metrics may take a while.