Fig. 7
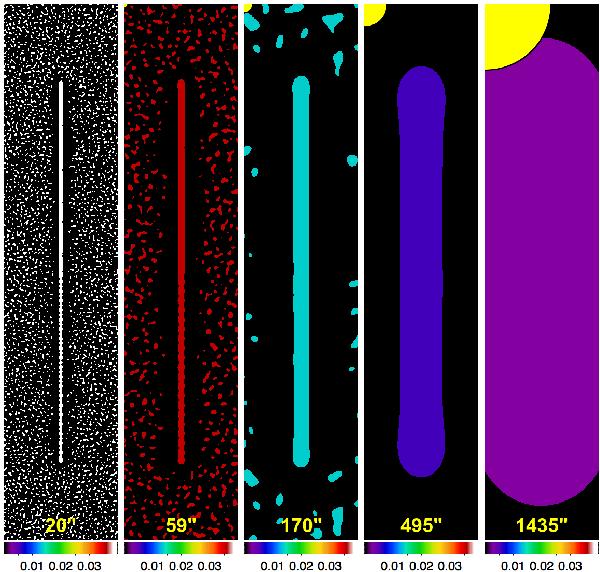
Single-scale masking of filaments (Sect. 2.4). The images of spatial scales from Fig. 4 are shown here exactly on the intensity threshold
 for detection of filaments, and all lower level signals were set to zero. The
simulated filament is clearly visible on all scales, as is the abundant
contamination of the images by noise. Noise-free black zones that appear to
surround the filament are the consequence of the negative areas seen in Figs.
4 and 6.
for detection of filaments, and all lower level signals were set to zero. The
simulated filament is clearly visible on all scales, as is the abundant
contamination of the images by noise. Noise-free black zones that appear to
surround the filament are the consequence of the negative areas seen in Figs.
4 and 6.
Current usage metrics show cumulative count of Article Views (full-text article views including HTML views, PDF and ePub downloads, according to the available data) and Abstracts Views on Vision4Press platform.
Data correspond to usage on the plateform after 2015. The current usage metrics is available 48-96 hours after online publication and is updated daily on week days.
Initial download of the metrics may take a while.